The Unity Memory Leak Detective: How I Learned to Hunt Down Memory Issues Before They Crash Your Game
A deep dive into the tools, strategies, and detective work required to create stable, professional games by mastering memory management in Unity.

Here's the thing about unity memory leak issues - they're like that one friend who eats all your snacks without asking. At first, everything seems fine. Your game runs smoothly, players are happy, and you're feeling pretty good about your code. Then slowly, almost imperceptibly, things start going wrong. Frame rates drop. Loading times increase. And then, BAM! Your game crashes, leaving players frustrated and you scrambling to figure out what went wrong.
I remember my first major encounter with memory issues back when I was working on a mobile game. Took me months to figure out that a simple list I was using to track game objects was actually the villain slowly eating up all available memory. That experience taught me something valuable: investigating memory issues in unity isn't just about fixing bugs - it's about becoming a detective, learning to read the clues, and solving the mystery before it becomes a disaster.
Why Your Unity Game is Secretly Eating Memory (And You Don't Even Know It)
Let me paint you a picture. You've built this amazing endless runner - players are jumping, coins are collecting, obstacles are appearing and disappearing. Everything looks perfect in the editor. But here's what's happening behind the scenes: every single coin, every obstacle, every particle effect you create is taking up a little piece of memory. And if you're not careful about how you manage that memory, your game becomes like a leaky bucket, slowly draining your device's resources until it can't keep up anymore.
This is what investigating memory issues in unity is really about - it's the process of diagnosing and fixing problems related to how your game uses computer memory. A memory leak occurs when a program allocates memory for an object but fails to release that memory when the object is no longer needed. Think of yourself as a detective; memory is your crime scene, and tools like the Unity Profiler are your magnifying glass, helping you find clues (leaks, large assets) to solve the case of the crashing game.
The crazy part? This solves one of the most critical challenges in game development: preventing crashes, stuttering, and poor performance caused by inefficient memory management. By learning to investigate memory, you can create more stable and professional games that run smoothly on a wider range of devices, from high-end PCs to mobile phones.

Actually, wait - let me tell you why this matters so much. Been there myself, and I've seen countless student developers get their games rejected from app stores or receive terrible reviews because of memory-related crashes. The solution isn't just about fixing bugs; it's about understanding what's happening under the hood.
The Memory Types Every Unity Developer Should Know
When I first started hunting down unity memory leak problems, I was completely confused by all the different types of memory Unity talks about. Here's what I wish someone had explained to me from day one:
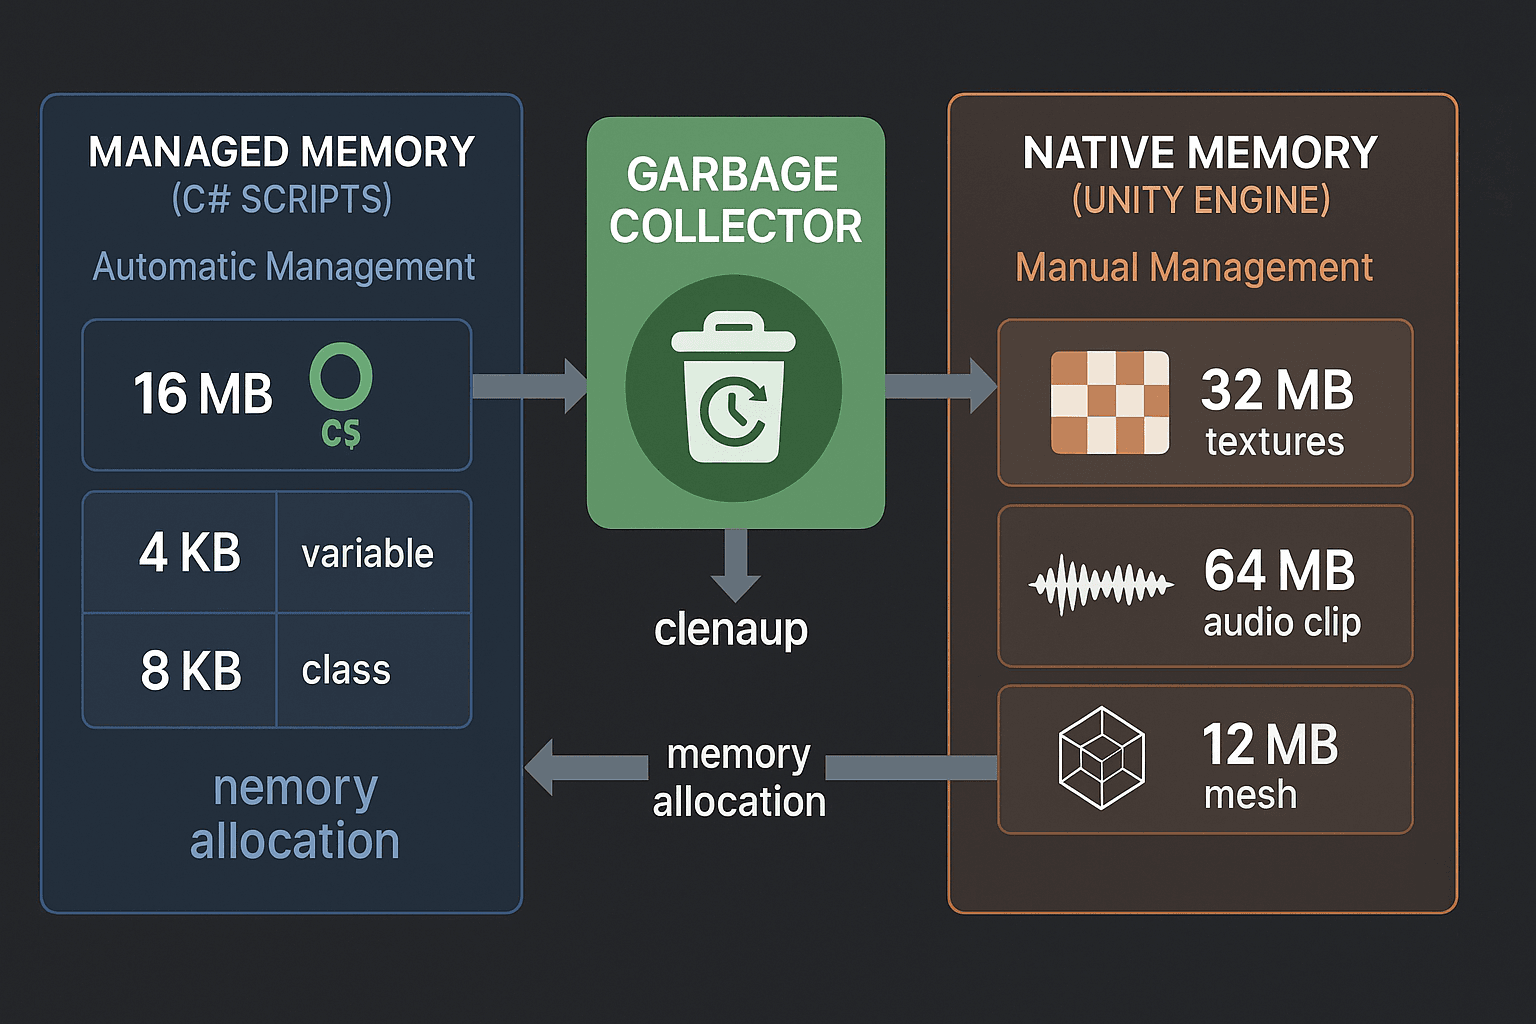
Managed Memory (The Heap): This is the memory used by your C# scripts. It holds all your classes, objects, and variables. This memory is automatically managed by the Garbage Collector (GC).
Native Memory: This is the memory used by the Unity Engine itself, outside of C# code. It contains large assets like textures, audio clips, meshes, and shaders. You must manage this memory manually by loading and unloading assets correctly.
Garbage Collector (GC): The GC is an automatic memory manager for the managed heap. It periodically scans for objects that are no longer referenced and frees that memory. While helpful, this process can be slow and cause noticeable hitches or stutters in your game.
Now here's where things get tricky. A unity memory leak occurs when memory is allocated but never released, even after it's no longer needed. Over time, this causes your game's memory usage to grow continuously until it eventually crashes.
Static References: A common cause of memory leaks. A static variable holds a reference to an object, preventing the GC from ever cleaning it up because static variables live for the entire duration of the application. I learned this one the hard way - took me weeks to realize a single static list was causing all my problems.
Your Detective Toolkit: Profilers and Memory Snapshots
Here's the thing about tools for unity memory leak detection - Unity gives you everything you need, but you have to know which tool to use when.
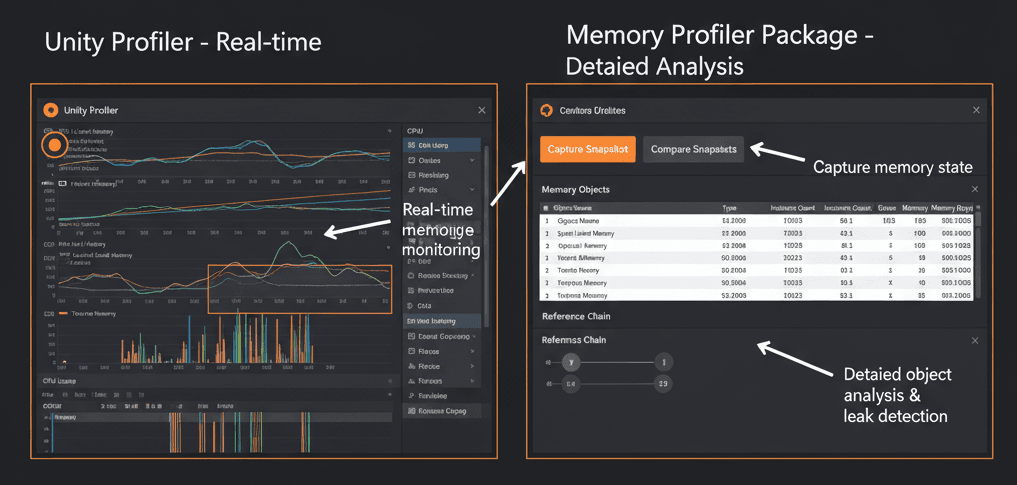
Unity Profiler: The primary built-in tool for analyzing your game's performance in real-time, including CPU usage, rendering, and a basic overview of memory. This is your first stop for any investigation.
Memory Profiler (Package): A separate, more powerful, and essential tool available from the Package Manager. It allows you to take detailed snapshots of memory and analyze them offline to pinpoint the exact cause of memory issues.
The core of memory investigation is capturing a "snapshot" of the entire memory state at a specific moment. The Memory Profiler package is the tool for this. You can then compare snapshots to see what changed.
You know what's funny? You can actually trigger snapshots from your code for precise timing:
// You can trigger snapshots from code for precise timing.

using UnityEngine.Profiling;

public class MemorySnapshotter : MonoBehaviour
{
void Update()
{
if (Input.GetKeyDown(KeyCode.S))
{
// This captures a snapshot that can be analyzed in the Memory Profiler window.
MemoryProfiler.TakeSnapshot("MySnapshot", (path, success) => {
Debug.Log(success ? $"Snapshot saved to {path}" : "Failed to save snapshot.");
});
}
}
}
One more thing that's super important - the Memory Profiler helps you find out why an object is still in memory by showing you its reference chain. This chain shows you the path of objects, starting from a root (like a static variable), that holds the leaked object in memory.
The Profiler Connection is crucial too: The Unity Profiler can connect to your game running in the Editor or on a target device. For memory investigation, it's crucial to profile on the actual target device, as memory usage can differ significantly from the Editor.[6]
The Two-Tool Approach I Use for Every Memory Investigation
After years of debugging memory issues in unity, I've settled on a systematic approach that works every time. Here's my go-to comparison that I teach every student:
| Criteria | Approach A: Built-in Profiler (Simple View) | Approach B: Memory Profiler Package (Detailed View) |
|---|---|---|
| Best For | Getting a quick, real-time overview of memory usage and spotting large, obvious spikes. | Deep, detailed, offline analysis of memory leaks and asset usage by comparing snapshots. |
| Performance | Runs in real-time, can have a minor impact on game performance while profiling. | Analysis is done offline on a captured snapshot, having no performance impact on the game itself. |
| Complexity | Very easy to use. Just open the Profiler window and press record. | Requires installing a package and learning a more complex interface for capturing and analyzing snapshots. |
| Code Example | // No code needed, just observe the graph in the Profiler window. |
// Code to capture a snapshot for later analysis.

UnityEngine.Profiling.MemoryProfiler.TakeSnapshot("SceneStart", (path, success) => {}); |
Usually, I start with the built-in profiler for a quick overview, then move to the Memory Profiler package when I need to dig deeper. This two-step approach has saved me countless hours of debugging.
code Code download content_copy expand_less IGNORE_WHEN_COPYING_START IGNORE_WHEN_COPYING_ENDThree Battle-Tested Strategies That Actually Work
Let me share the techniques that have saved my projects more times than I can count. These aren't just theoretical concepts - these are the practices I use in every single game I build.
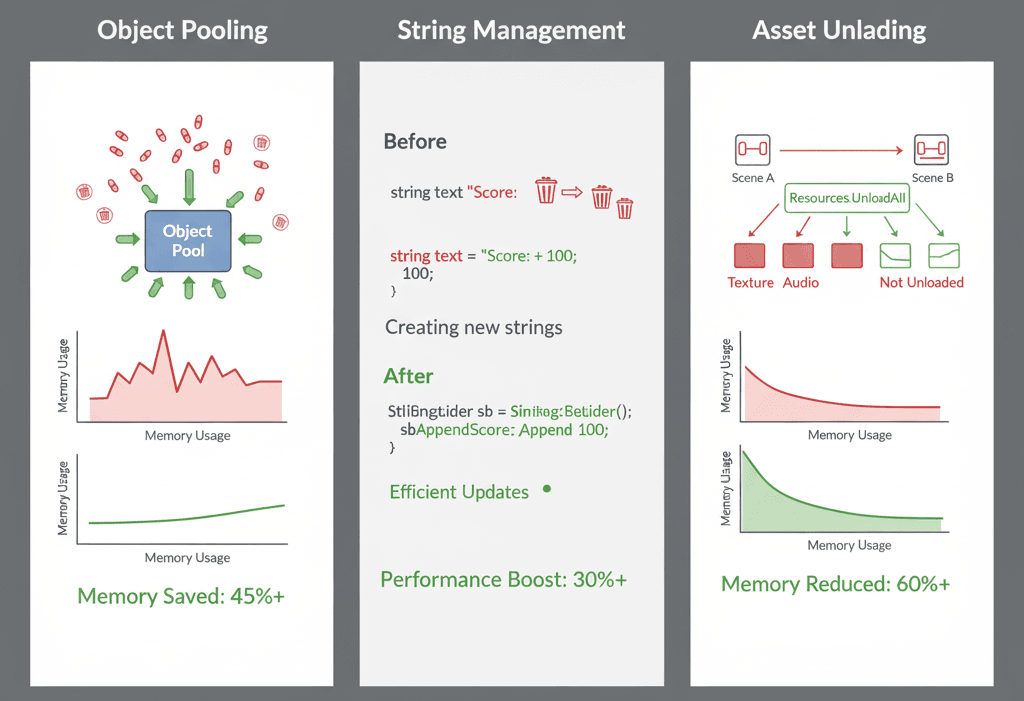
Strategy 1: Object Pooling (The Game-Changer)
Instead of frequently instantiating and destroying objects (like bullets or enemies), reuse them from a pre-allocated "pool." This is the number one way to reduce GC pressure.
// Bad: Creates garbage every time a bullet is fired.

void Fire()
{
Instantiate(bulletPrefab, transform.position, Quaternion.identity);
}

// Good: Reuses an existing bullet from a pool.
void FireFromPool()
{
GameObject bullet = bulletPool.Get();
bullet.transform.position = transform.position;
bullet.SetActive(true);
}Strategy 2: Stop the String Concatenation Madness
Repeatedly combining strings with the + operator creates a new string in memory every frame, generating a lot of garbage. Been there, done that, learned my lesson.
// Bad: Creates a new string every frame.

void Update() { myText.text = "Score: " + score; }

// Good: Use a StringBuilder or pre-allocate strings.
private System.Text.StringBuilder scoreBuilder = new System.Text.StringBuilder(12);
void Update()
{
scoreBuilder.Clear();
scoreBuilder.Append("Score: ");
scoreBuilder.Append(score);
myText.text = scoreBuilder.ToString();
}Strategy 3: Asset Management That Actually Works
Explicitly unload assets you are no longer using, especially when changing scenes or levels. The Addressable Asset System is a Unity system that simplifies asset management by using asynchronous loading from any location.
// When you are finished with an asset loaded from an AssetBundle or Addressables.

Addressables.Release(myLoadedAssetHandle);
Here's the key benefits that make all this effort worth it:
- Prevent Crashes: The most direct benefit. Running out of memory is a primary cause of application crashes, especially on mobile devices with limited RAM.[3]
- Improve Performance: Reduces stuttering and hitches caused by the Garbage Collector having to clean up large amounts of frequently allocated memory.
- Reduce Build Size: By identifying and optimizing or removing unnecessarily large assets, you can significantly decrease your game's download and installation size.
- Wider Device Compatibility: A memory-efficient game can run on older devices with less RAM, expanding your potential audience.
Real Games, Real Solutions: How the Pros Handle Memory
Let me tell you about some implementations that absolutely blew my mind when I first discovered them. These are real techniques used in games you probably play every day.
The Endless Runner Approach: In an endless runner like *Subway Surfers*, new obstacles, coins, and background elements are constantly appearing and disappearing. Instead of instantiating new objects, the game uses a highly optimized object pooling system. As objects go off-screen, they are disabled and returned to the pool, ready to be reused moments later. The result? The game runs smoothly at a high speed without any stuttering, which would be unavoidable if it were creating and destroying thousands of objects every minute.
The Open-World Solution: An open-world game like *Genshin Impact* has a massive world that cannot possibly fit into memory all at once. The game is broken into chunks. As the player moves, the game engine streams new chunks (terrain, textures, enemies) into memory while unloading the chunks that are now far away. This is managed with a system like Addressables. What the player experiences is a vast, seamless world without loading screens, because the memory is being carefully managed behind the scenes.
These aren't just cool features - they're essential survival techniques for any game that wants to succeed in the market.
From Zero to Memory Detective: My Step-by-Step Blueprint
Here's the exact process I follow when hunting down memory issues. I've used this blueprint dozens of times, and it works every single time.
Blueprint 1: Finding a Simple List Leak with the Profiler
Scenario Goal: To identify a common unity memory leak where a script continuously adds objects to a list but never removes them.
Unity Editor Setup:
- Create a new C# script named
LeakyScript. - Create an empty GameObject in your scene and attach
LeakyScriptto it.
Step-by-Step Code Implementation:
First, write the leaky code. This script adds a new GameObject to a static list every frame:
// File: LeakyScript.cs

using UnityEngine;
using System.Collections.Generic;

public class LeakyScript : MonoBehaviour
{
public static List leakyList = new List();

code
Code
download
content_copy
expand_less
IGNORE_WHEN_COPYING_START
IGNORE_WHEN_COPYING_END
void Update()
{
    // This is a memory leak! We add to the list but never remove.
    leakyList.Add(new GameObject("Leaky Object"));
}

}
Next, profile the game: Open the Unity Profiler (Window > Analysis > Profiler). Press the "Record" button and run the game.
Finally, analyze the graph: Watch the "GC Reserved Memory" graph in the Memory module. You will see it steadily climb upwards. This indicates your memory usage is constantly growing, a clear sign of a leak.
Blueprint 2: Pinpointing a Leaked Object with the Memory Profiler Package
Scenario Goal: To find the exact object that is being leaked between scenes and identify the static reference that is keeping it in memory.
Unity Editor Setup:
- Go to
Window > Package Manager, find theMemory Profilerpackage, and install it. - Create two scenes:
SceneAandSceneB. - In
SceneA, create a scriptLeakySingleton.csand place it on a GameObject.
Step-by-Step Code Implementation:
Create the leaking singleton. This script creates a static instance of itself, but doesn't clear it when the scene changes, causing a leak:
// File: LeakySingleton.cs
using UnityEngine;
public class LeakySingleton : MonoBehaviour
{
public static LeakySingleton instance;
// This large array is just to make the object's size obvious in the profiler.
private byte[] largeData = new byte[1024 * 1024]; // 1MB
code
Code
download
content_copy
expand_less
IGNORE_WHEN_COPYING_START
IGNORE_WHEN_COPYING_END
void Awake()
{
if (instance == null)
{
instance = this;
DontDestroyOnLoad(gameObject);
} else {
Destroy(gameObject);
}
}
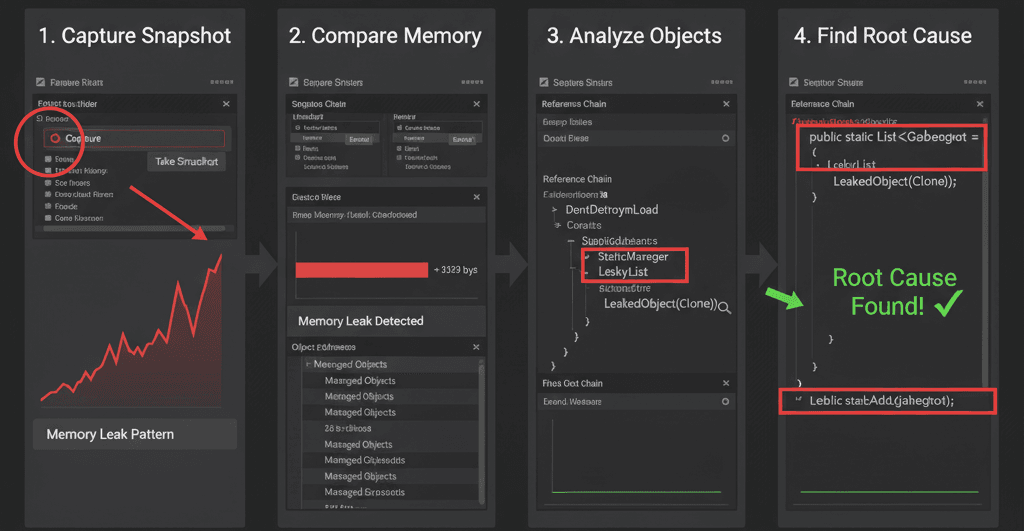
}Capture snapshots: Open the Memory Profiler window (Window > Analysis > Memory Profiler). Run the game in SceneA. In the Memory Profiler, click "Capture Player". After it's captured, load SceneB, and then capture another snapshot.[7][17]
Compare snapshots: In the Memory Profiler window, select both snapshots and click "Diff". The diff view will show you all "New" objects.[7][17] You will see your LeakySingleton object in this list. Clicking on it will show you the reference chain, pointing directly to the static instance variable as the cause of the leak.
Blueprint 3: Identifying and Optimizing Large Texture Assets
Scenario Goal: To find which textures are using the most native memory and reduce their memory footprint.
Unity Editor Setup:
- Have a project with several textures, preferably some large ones (e.g., 4K resolution).
- Install the
Memory Profilerpackage.
Step-by-Step Code Implementation:
Capture a snapshot: Run your game and open the Memory Profiler window. Capture a snapshot of your game when the scene with the textures is loaded.
Analyze the snapshot: Open the captured snapshot. In the main view, switch to the "Table" view and select "All Of Memory".
Sort by size: Click on the "Size" column to sort all objects in memory by their size. At the top, you will likely see your largest textures (Texture2D).
Optimize the texture: Select the large texture in the Project window. In the Inspector, you can now make changes to reduce its memory usage:
- Lower the "Max Size" (e.g., from 4096 to 2048).
- Enable "Crunch Compression" for a significant size reduction.
- Change the "Format" to a more compressed one like DXT5.
Re-capture and verify: After applying the changes, capture a new snapshot and compare it to the old one to verify the memory savings.
Ready to Start Building Your First Game?
You know what's exciting about mastering memory management? It's one of those skills that immediately separates you from casual Unity users and puts you in the realm of professional game developers. The techniques I've shared here aren't just theory - they're the exact same strategies used by teams at major game studios.
But here's the thing - reading about memory management is just the first step. The real learning happens when you're building actual games, encountering real problems, and applying these solutions in practice. That's exactly why I created comprehensive courses that take you from basic Unity concepts all the way to building and publishing professional-quality games.
If you're ready to take your game development skills to the next level and learn how to build games that don't just work, but work efficiently and professionally, check out my complete game development course. You'll learn memory optimization alongside all the other essential skills that game studios actually look for in developers.
What This Knowledge Will Do for Your Game Development Career
Learning to investigate and fix memory issues in unity isn't just about preventing crashes - it's about developing the systematic thinking and problem-solving skills that define professional game developers.
Here's what mastering this skillset will do for you: First, you'll prevent crashes, which is the most direct benefit. Running out of memory is a primary cause of application crashes, especially on mobile devices with limited RAM. Second, you'll dramatically improve performance by reducing stuttering and hitches caused by the Garbage Collector having to clean up large amounts of frequently allocated memory.
But the benefits go beyond just technical improvements. You'll also reduce your build size by identifying and optimizing or removing unnecessarily large assets, significantly decreasing your game's download and installation size. This leads to wider device compatibility, because a memory-efficient game can run on older devices with less RAM, expanding your potential audience.
Most importantly, you'll develop the detective mindset that separates good developers from great ones - the ability to systematically investigate problems, understand complex systems, and implement elegant solutions.
Key Takeaways
- Unity memory leak detection starts with understanding the difference between managed memory (handled by Garbage Collector) and native memory (handled manually)
- The two-tool approach works best: Use Unity's built-in Profiler for real-time overview, then Memory Profiler package for detailed analysis
- Object pooling is the number one technique for preventing memory leaks - reuse objects instead of constantly creating and destroying them
- Static references are the most common cause of memory leaks because they prevent Garbage Collection throughout the application lifetime
- Memory snapshots and comparison are essential for pinpointing exact causes of leaks between different game states
- String concatenation in Update() methods creates massive amounts of garbage - use StringBuilder instead
- Asset management requires manual unloading of textures, audio, and other large assets when changing scenes
- Profile on target devices, not just in editor, because memory usage differs significantly between platforms
Common Questions
What is a unity memory leak and how do I know if my game has one?
A unity memory leak happens when your game allocates memory but never releases it, even when it's no longer needed. You can identify leaks by watching the Memory graph in Unity's Profiler - if memory usage keeps climbing and never goes down, you likely have a leak.
How do I investigate memory issues in unity without breaking my game's performance?
Use Unity's Memory Profiler package to capture snapshots, which allows offline analysis without impacting game performance. For real-time monitoring, use the built-in Profiler during development only, not in released builds.
What's the difference between managed and native memory in Unity?
Managed memory holds your C# script objects and is automatically cleaned up by the Garbage Collector. Native memory contains Unity engine data like textures and meshes, which you must manually load and unload.
When should I use object pooling to prevent memory leaks?
Use object pooling whenever you frequently create and destroy the same type of objects, like bullets, enemies, particles, or UI elements. It's especially critical in games with rapid object spawning.
Why do static references cause unity memory leak problems?
Static variables exist for the entire application lifetime, so any objects they reference can never be garbage collected. This creates permanent memory allocations that grow over time.
How can I use unity memory leak detection tools effectively?
Start with Unity's built-in Profiler for overview, then use Memory Profiler package for detailed investigation. Take snapshots before and after suspected problem areas, then compare them to find leaked objects.
What causes the most common memory issues in unity games?
The biggest culprits are: static references holding onto objects, frequent string concatenation in update loops, not unloading assets when changing scenes, and creating/destroying objects instead of pooling them.
How do I find memory leaks using Unity's Memory Profiler package?
Install the package, capture snapshots at different game states, then use the "Diff" feature to compare them. Look for objects that should have been destroyed but are still referenced in memory.
What's the best way to optimize texture memory usage in Unity?
Use the Memory Profiler to identify your largest textures, then optimize them by reducing Max Size, enabling Crunch Compression, and choosing more efficient formats like DXT5 instead of uncompressed formats.
How can memory management improve my Unity game's performance on mobile devices?
Proper memory management prevents crashes on RAM-limited devices, reduces GC stuttering, decreases loading times, and allows your game to run on older hardware, expanding your potential audience.