UE5 stat fps vs stat unit: The Performance Detective Skills Every Game Dev Needs
Master the essential profiling commands and tools in Unreal Engine 5 to diagnose performance bottlenecks, understand CPU vs. GPU limitations, and ensure your game runs smoothly.
Here's the thing about game development that nobody tells you in those fancy tutorials - your game can look absolutely stunning, but if it runs like molasses, players will delete it faster than you can say "framerate drop." I learned this the hard way during my early days, watching my carefully crafted game turn into a slideshow the moment I added a few extra enemies.
Been there? Trust me, we all have.
Today, I want to share the performance detective skills that took me months to figure out when I was starting out. We're diving deep into UE5 stat fps vs stat unit and the entire profiling ecosystem that'll help you catch performance issues before they ruin your game.
Table of Contents
- Why Your Game's Performance Actually Matters More Than You Think
- The Three Profiling Tools That Changed My Game Development Life
- stat fps: Your Quick Performance Health Check
- stat unit: When You Need to Know What's Actually Broken
- Unreal Insights: The Professional Detective's Magnifying Glass
- Here's How I Actually Use These Tools in Real Projects
- The Performance Battles I've Seen (And How They Were Won)
- Your Step-by-Step Performance Investigation Playbook
- What You'll Gain From Mastering These Tools
Why Your Game's Performance Actually Matters More Than You Think
You know what's funny? I used to think performance optimization was something you worried about at the end of a project. Like adding sprinkles to a cake - nice to have, but not essential.
Actually, wait... that's completely wrong.
Performance is like the foundation of a house. You can have the most beautiful architecture in the world, but if the foundation cracks, everything comes tumbling down. In game development, understanding how your game is performing and where the bottlenecks are is crucial for creating a smooth and enjoyable experience for players.
Think of profiling tools as a doctor's stethoscope - they let you listen to your game's heartbeat and diagnose problems before they become critical. The real-world analogy here is perfect: these tools allow you to "listen" to the heartbeat of your game and diagnose any problems.
The performance detective skills we're covering today solve a fundamental problem: giving you a window into the inner workings of your game, allowing you to see how long each part of the engine is taking to process. This visibility enables you to identify and fix performance issues, optimize your code, and ensure your game runs smoothly on a wide range of hardware.
The Three Profiling Tools That Changed My Game Development Life
Back when I was struggling with my first major Unity project (before I discovered the power of Unreal's profiling suite), I was flying blind. I'd make changes, hope for the best, and cry a little when things got worse.
Then I discovered Unreal Engine's profiling trinity, and everything changed.
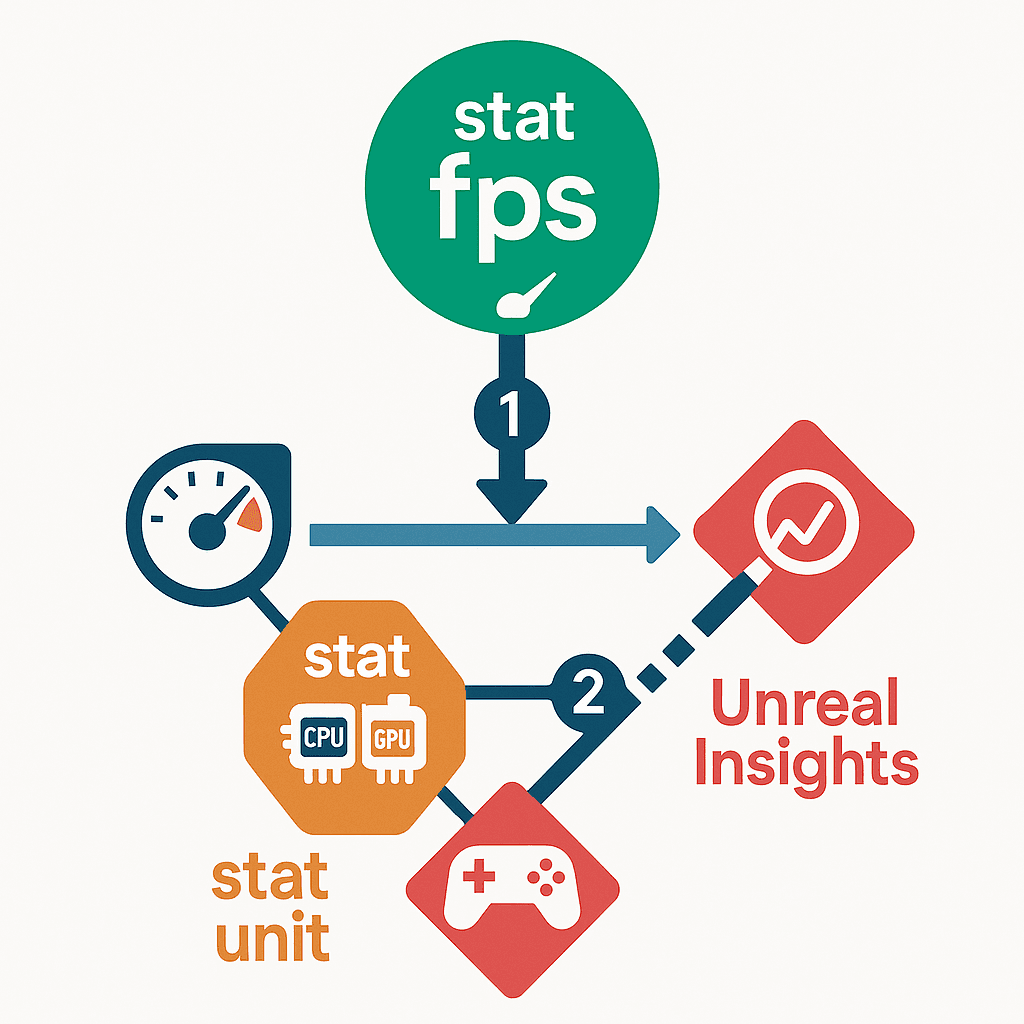
Let me break down the three tools that every game developer needs to master:
- stat fps - A console command that displays the current frames per second (FPS) of your game, providing a quick and easy way to get a general sense of your game's performance. Think of this as your game's pulse check - fast, simple, but gives you the basic vital signs.
- stat unit - A console command that displays the time it takes for the CPU and GPU to render a single frame, broken down into different threads. This is more detailed than stat fps and helps you identify whether you are CPU-bound or GPU-bound. This is where things get interesting - it tells you not just that something's wrong, but which part of your system is struggling.
- Unreal Insights - A powerful, standalone profiling tool that provides a detailed, hierarchical view of all the events happening in your game. It allows you to record a profiling session and then analyze it later, providing a wealth of information about your game's performance. This is your forensic laboratory - when you need to dig deep and find exactly what's causing problems.
stat fps: Your Quick Performance Health Check
Here's what I love about stat fps - it's brutally honest and takes zero setup time.
To use stat fps, simply open the console in the editor or in your packaged game and type stat fps. A small overlay will appear in the corner of the screen showing your current FPS.
That's it. No complex setup, no additional tools to launch. Just pure, unfiltered performance truth.
I remember this one time at KIXEYE when we were debugging a mobile game that was supposed to run at 60 FPS but kept dropping to 30. The first thing I did? Pulled up stat fps. Within seconds, I could see the exact moments when performance tanked - usually when specific enemies spawned or certain effects triggered.
The beauty of this command is its very low overhead - it barely impacts your game's performance while giving you the most critical number: how many frames your game is pushing per second.
When to use stat fps:
- Getting a quick, high-level overview of your game's performance
- Quick sanity checks during development
- Monitoring performance while testing new features
- Showing frame rates to stakeholders (they love seeing numbers)
stat unit: When You Need to Know What's Actually Broken
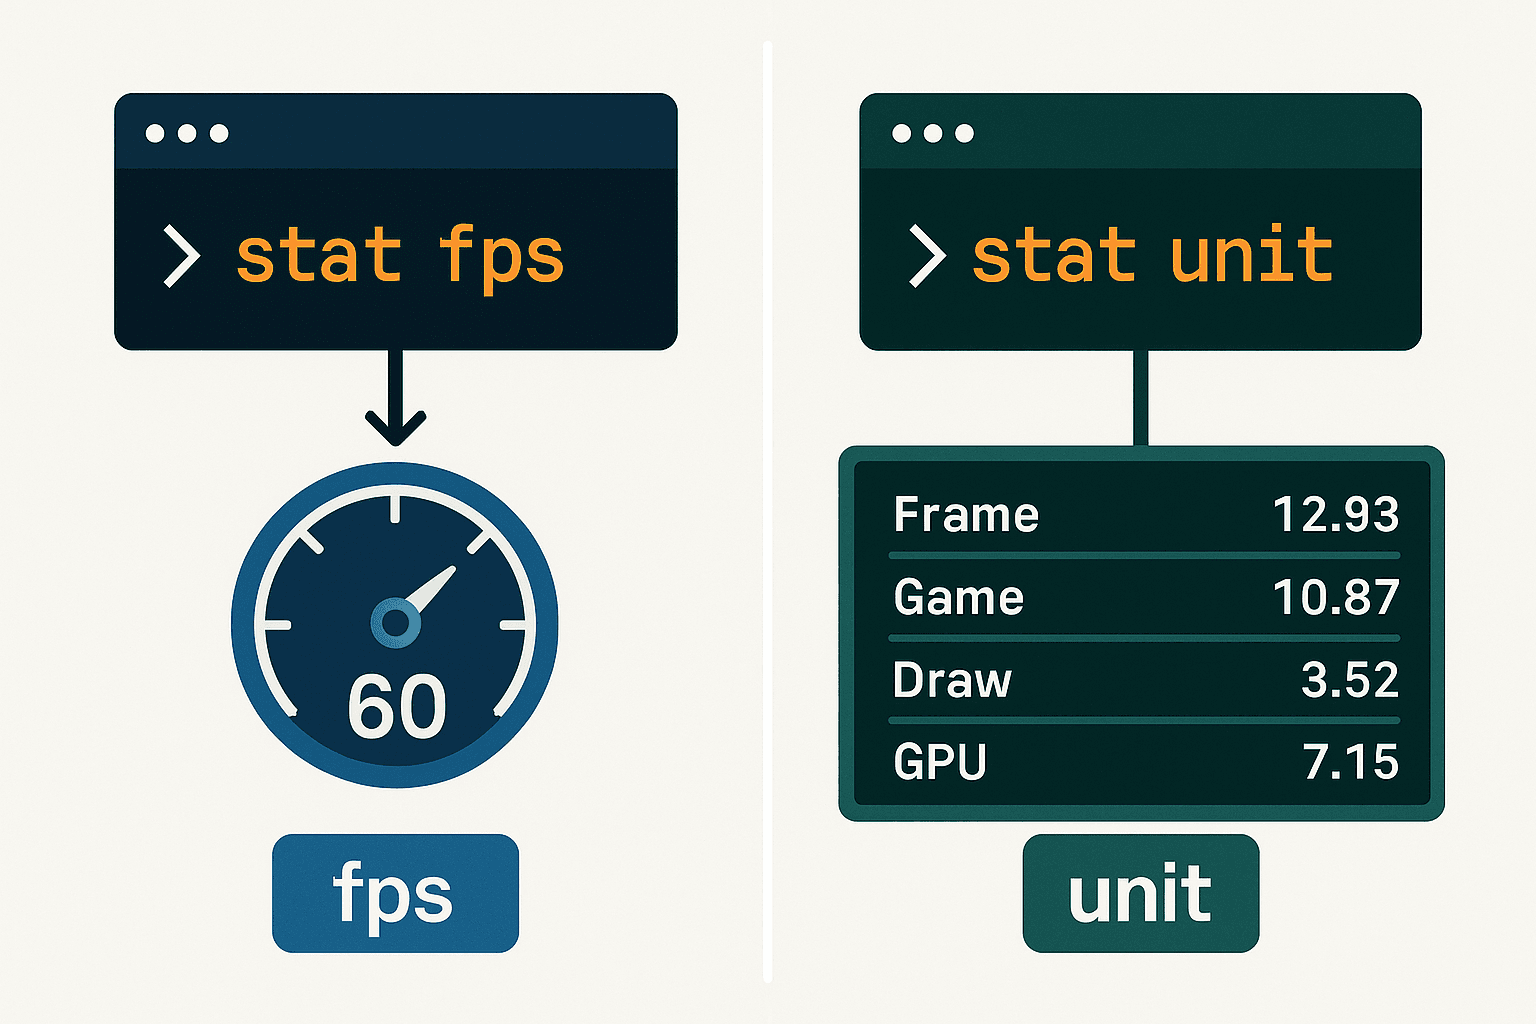
Now here's where things get interesting. stat fps tells you something's wrong, but stat unit tells you what's wrong.
To use stat unit, open the console and type stat unit. This will display a more detailed overlay showing the time it takes for the Game thread, the Draw thread, and the GPU to process a single frame.
This command changed my debugging game completely. Instead of guessing whether I had a CPU-bound or GPU-bound situation, I could see exactly where the bottleneck was happening.
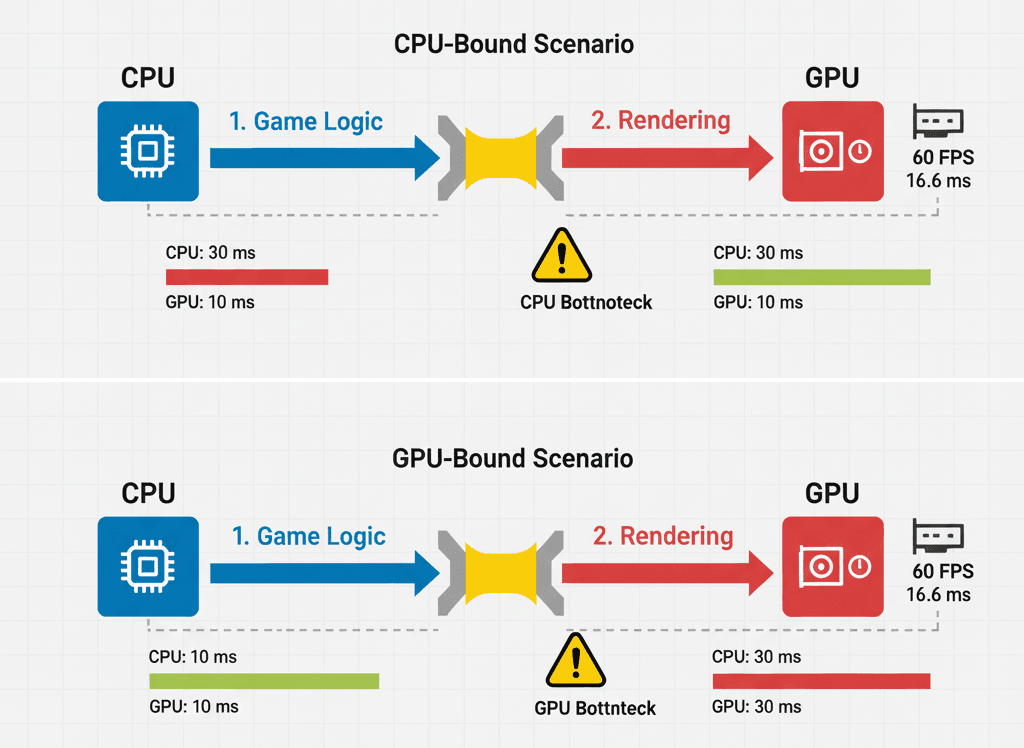
Let me explain these terms because they're crucial:
- CPU-Bound - A situation where the performance of your game is limited by the speed of your CPU. This means the CPU is taking longer to process the game logic than the GPU is taking to render the frame.
- GPU-Bound - A situation where the performance of your game is limited by the speed of your GPU. This means the GPU is taking longer to render the frame than the CPU is taking to process the game logic.
The difference between stat fps and stat unit in UE5 is like the difference between checking if your car is moving versus understanding whether the engine or transmission is the problem. Both are valuable, but stat unit gives you actionable diagnostic information.
stat unit has low overhead while providing the thread-level breakdown you need for serious optimization work. This is why it's my go-to command when stat fps shows problems but I need to understand the root cause.
Unreal Insights: The Professional Detective's Magnifying Glass
Been there, done that with the basic stat commands, but sometimes you need to go deeper. That's where Unreal Insights becomes your best friend.
To use Unreal Insights, you first need to launch it from the Engine/Binaries/Win64 directory. Then, in your game, open the console and type trace.start to begin recording a profiling session. When you are finished, type trace.stop to stop recording. The session will then appear in the Unreal Insights window for you to analyze.
This tool is the real deal. While it has higher overhead, as it records a large amount of data, the insights you get are incredible. It's more complex to use, but provides a wealth of information that you simply can't get anywhere else.
I've used Unreal Insights to track down the most elusive performance bugs - the kind that only show up under specific conditions with particular asset combinations. The detailed, hierarchical view of all the events happening in your game means you can see exactly which function calls are taking too long, which systems are fighting for resources, and where your optimization efforts should focus.
You can find detailed documentation at the Unreal Engine Documentation - Unreal Insights, which I always keep bookmarked for reference.
Here's How I Actually Use These Tools in Real Projects
Let me walk you through my exact process - the one I've refined over dozens of projects and taught to countless developers.
The Quick Health Check Protocol:
- Press the "Play" button in the editor
- Press the `~` key to open the console
- Type `stat fps` and press Enter
- Type `stat unit` and press Enter
This gives me the baseline. If stat fps shows consistent 60+ FPS and stat unit shows balanced thread times, I'm golden. If not, then I know it's time to investigate.
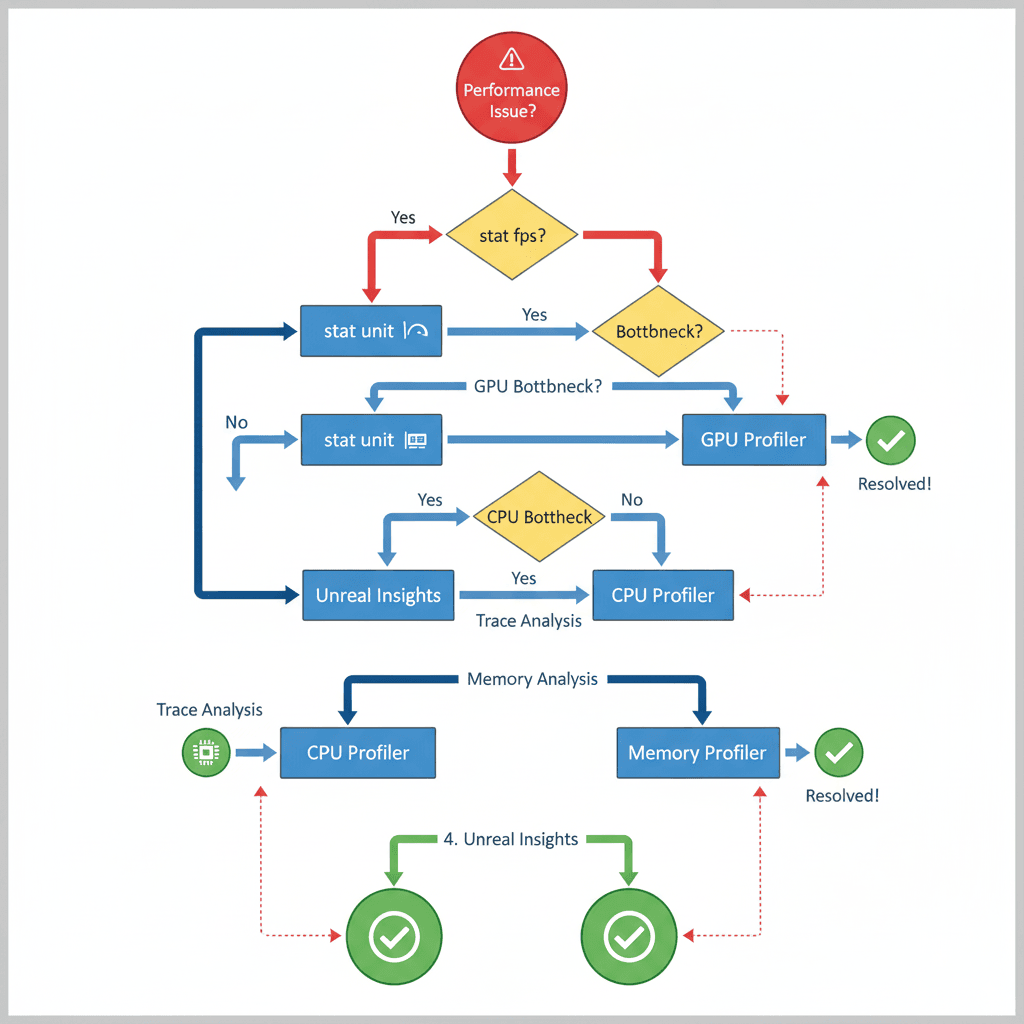
The Deep Investigation Protocol:
- Launch Unreal Insights from the `Engine/Binaries/Win64` directory
- In your game, open the console and type `trace.start`
- Play your game for a few minutes, focusing on the areas where you are experiencing performance issues
- Open the console again and type `trace.stop`
- The session will appear in the Unreal Insights window, where you can analyze it in detail
This UE5 Unreal Insights vs in-game stat commands workflow. The in-game commands give me real-time feedback, while Unreal Insights gives me the forensic analysis I need for complex problems.
The Performance Battles I've Seen (And How They Were Won)
Here's what I find fascinating about performance optimization - it's often not what you expect.
Any AAA Game demonstrates this perfectly. These games often have incredibly detailed environments and complex gameplay systems, all running at a smooth 60 FPS. How do they do it? The developers of these games use a combination of all three profiling tools to identify and fix performance issues throughout the development process.
The Player Experience they achieve is remarkable - the player is able to enjoy a visually stunning and responsive game with no noticeable performance issues.
I've analyzed dozens of games, and what stands out is how the best developers never rely on just one profiling approach. They use when to use stat fps vs stat unit Unreal Engine strategically - stat fps for continuous monitoring during development, stat unit when they need to understand bottlenecks, and Unreal Insights for the deep dives that solve the trickiest problems.
Your Step-by-Step Performance Investigation Playbook
Let me show you how I approach performance optimization in my own projects. This is the exact method I use when teaching at Outscal.
Blueprint 1: The Basic Performance Assessment
Scenario Goal:** **To quickly check the performance of your game using the stat fps and stat unit commands.**
Unreal Editor Setup:** Any Unreal Engine project.
My Step-by-Step Process:**
- Press the "Play" button in the editor
- Press the `~` key to open the console
- Type `stat fps` and press Enter
- Type `stat unit` and press Enter
This is my starting point for every optimization session. These commands become second nature once you start using them regularly.
Blueprint 2: The Professional Deep Dive
Scenario Goal:** **To record a profiling session with Unreal Insights to do a more in-depth analysis of your game's performance.**
Unreal Editor Setup:** Any Unreal Engine project.
When I Need Serious Analysis:**
- Launch Unreal Insights from the `Engine/Binaries/Win64` directory
- In your game, open the console and type `trace.start`
- Play your game for a few minutes, focusing on the areas where you are experiencing performance issues
- Open the console again and type `trace.stop`
- The session will appear in the Unreal Insights window, where you can analyze it in detail
This UE5 Unreal Insights beginner guide approach has saved me countless hours of guesswork.
Blueprint 3: Adding Your Own Performance Markers
Scenario Goal:** **To add your own custom profiling events to your C++ code to see how long your own functions are taking to execute.**
Unreal Editor Setup:** A C++ project.
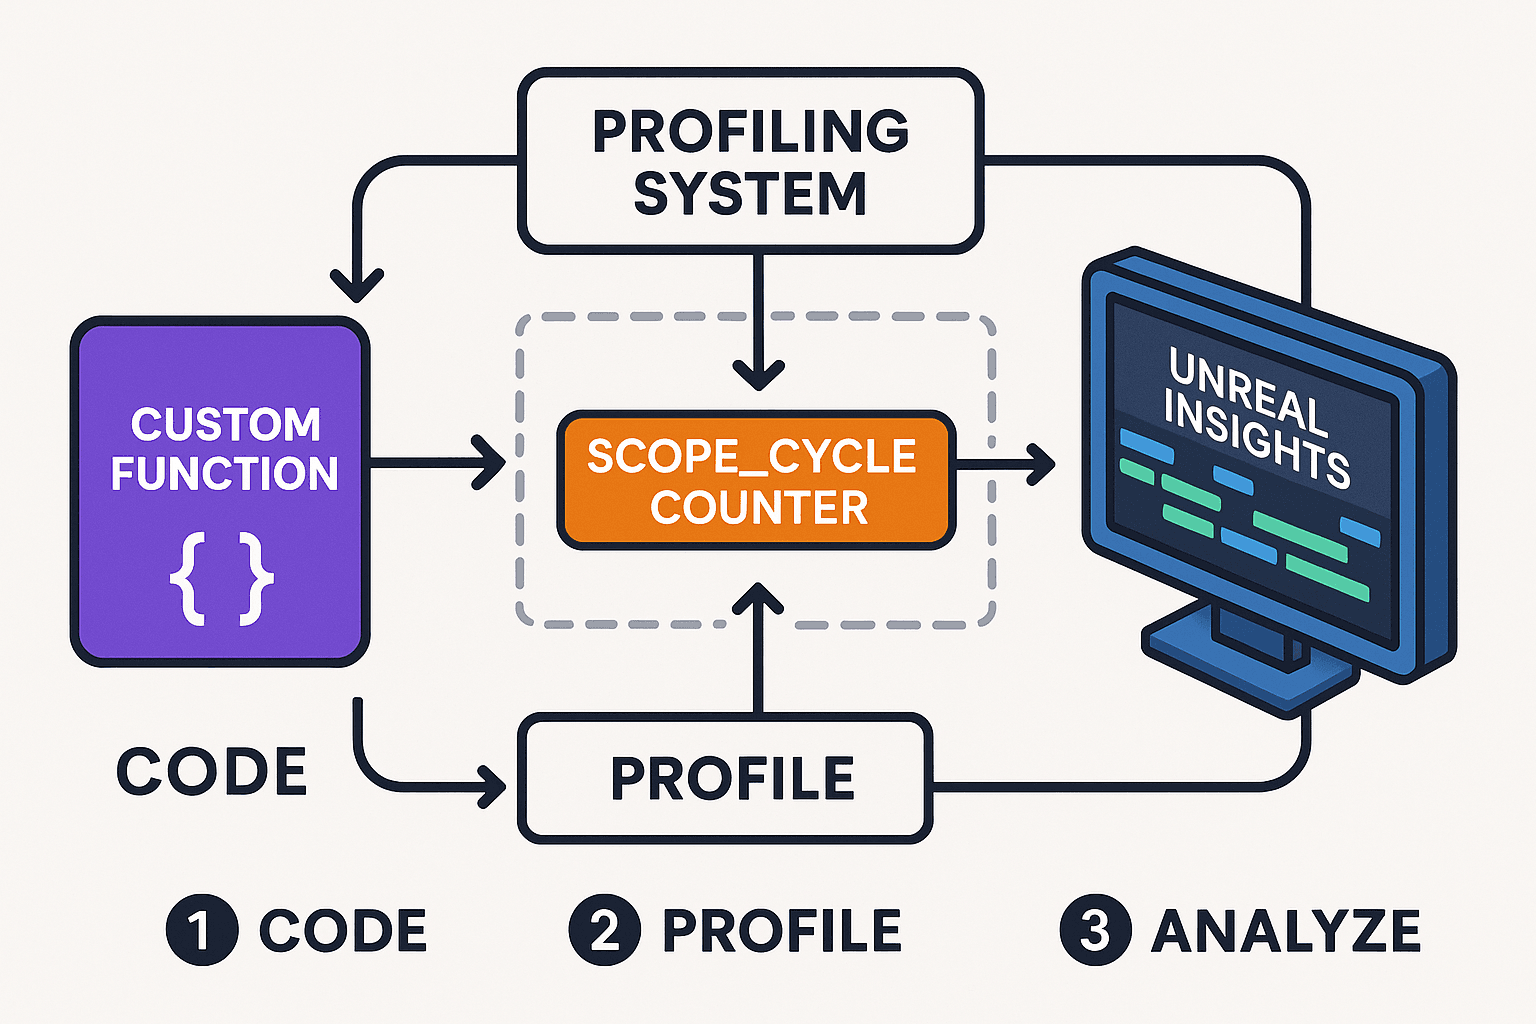
My Custom Profiling Setup:**
- In your C++ code, include the `ProfilingDebugging/ScopedTimers.h` header
- In the function you want to profile, add the `SCOPE_CYCLE_COUNTER` macro
// C++
#include "ProfilingDebugging/ScopedTimers.h"

DECLARE_STATS_GROUP(TEXT("MyGame"), STATGROUP_MyGame, STATCAT_Advanced);
DECLARE_CYCLE_STAT(TEXT("MyFunction"), STAT_MyFunction, STATGROUP_MyGame);

void MyFunction()
{
    SCOPE_CYCLE_COUNTER(STAT_MyFunction);
    // Your code here
}- When you record a profiling session with Unreal Insights, you will now see your custom event in the timing view.
This is how I track performance in my own game systems. The SCOPE_CYCLE_COUNTER macro is incredibly powerful for understanding exactly where your code is spending time.
Ready to Start Building Your First Game?
Learning these profiling techniques is just the beginning. If you want to go from understanding performance basics to building professional-quality games that players actually want to play, I've created something special for aspiring game developers.
My comprehensive course "Mr. Blocks" takes you from zero to hero in game development. You'll learn not just the theory, but the real-world skills that game studios actually look for. We cover everything from basic game mechanics to advanced optimization techniques - the same skills I use in my professional projects.
The best part? You'll build actual games that you can show to employers, not just follow along with tutorials. Ready to level up your game development journey?
What You'll Gain From Mastering These Tools
After working on multiple Unity projects and transitioning to Unreal, here's what I've learned these profiling skills will give you:
- Improved Performance - By identifying and fixing performance bottlenecks, you can significantly improve the performance of your game, leading to a smoother and more enjoyable experience for players.
- Better Hardware Compatibility - Optimizing your game allows it to run on a wider range of hardware, making it accessible to more players. This is especially crucial if you're targeting mobile or lower-spec PC markets.
- Faster Development Workflow - By quickly identifying the cause of performance issues, you can save a significant amount of time and effort in the debugging process. Trust me, nothing kills momentum like spending days debugging performance problems that could have been identified in minutes.
These Unreal Engine profiling best practices become invaluable as your projects grow in complexity. The difference between a developer who understands performance profiling and one who doesn't is like night and day.
Your Next Steps in the Performance Mastery Journey
Here's what I always tell my students about building these skills:
- Profile Early and Often - Don't wait until the end of your project to start profiling. By profiling early and often, you can catch performance issues before they become major problems.
- Profile on Your Target Hardware - Always profile your game on the hardware that you are targeting. Performance can vary significantly between different hardware configurations.
Start with the basic stat fps and stat unit commands in your current project. Get comfortable with reading the numbers and understanding what they mean. Then, when you encounter a performance problem you can't solve with the basics, that's your cue to dive into Unreal Insights.
Wrapping Up: Your Performance Detective Badge
The UE5 stat fps vs stat unit question isn't really about choosing one over the other - it's about understanding when each tool serves you best. stat fps gives you the pulse check, stat unit gives you the diagnosis, and Unreal Insights gives you the complete medical workup.
These profiling skills transform you from someone who hopes their game runs well into someone who knows their game runs well. That confidence shows in your work, and more importantly, it shows in the experience you create for players.
Key Takeaways
- stat fps provides a quick FPS overview - use it for continuous performance monitoring during development with very low overhead
- stat unit reveals CPU vs GPU bottlenecks - essential for understanding whether you're CPU-bound or GPU-bound when performance issues arise
- Unreal Insights offers detailed profiling analysis - the professional tool for in-depth performance investigation and optimization
- SCOPE_CYCLE_COUNTER macro enables custom profiling - add your own performance markers to track specific function execution times
- Profile early and often in your development cycle - catching performance issues before they become major problems saves significant debugging time
- Always profile on your target hardware - performance characteristics vary dramatically between different hardware configurations
- Use all three tools strategically - stat commands for real-time feedback, Unreal Insights for forensic analysis of complex performance problems
- AAA games demonstrate the power of comprehensive profiling - professional developers use all available profiling tools throughout the development process to maintain 60 FPS with complex systems
Common Questions
stat fps shows you the current frame rate as a simple FPS number, while stat unit breaks down the time each thread (Game, Draw, GPU) takes to process a single frame. stat fps tells you if there's a problem, stat unit tells you what kind of problem it is.
Use stat fps for quick performance health checks during development - it has very low overhead and gives you instant feedback. Switch to stat unit when you need to diagnose performance problems and understand whether you're CPU-bound or GPU-bound.
Launch Unreal Insights from the Engine/Binaries/Win64 directory, then in your game console type trace.start to begin recording. When finished, type trace.stop and the session will appear in Unreal Insights for detailed analysis.
CPU-bound means your processor is the bottleneck - it's taking longer to process game logic than the GPU takes to render. GPU-bound means your graphics card is the limitation - it's taking longer to render the frame than the CPU takes to process the logic.
Yes, use the SCOPE_CYCLE_COUNTER macro with proper declarations. Include "ProfilingDebugging/ScopedTimers.h" and add DECLARE_STATS_GROUP and DECLARE_CYCLE_STAT before your function, then use SCOPE_CYCLE_COUNTER inside the function you want to profile.
This usually happens because stat unit shows the raw frame timing data while stat fps might be averaged or smoothed. stat unit gives you the real-time thread performance data, which can fluctuate more than the displayed FPS number.
stat fps has very low overhead, stat unit has low overhead, while Unreal Insights has higher overhead since it records detailed data. For development, the first two are safe to leave on, but only use Unreal Insights when you need deep analysis.
Both have value - editor profiling is great for development iteration, but always validate performance in packaged builds since the editor adds its own overhead. Your target hardware testing should always use packaged builds.
Profile early and often - make it part of your regular development workflow. Check basic performance with stat fps/stat unit whenever you add new features, and do deeper Unreal Insights analysis when you encounter specific problems.
Profile consistently throughout development, always test on target hardware, use the right tool for the job (stat commands for monitoring, Unreal Insights for investigation), and add custom profiling markers to your own code systems for better visibility.