Why Your Game Stutters (And How Unity Profiler Becomes Your Detective)
Transform performance guesswork into data-driven optimization for professional-quality games

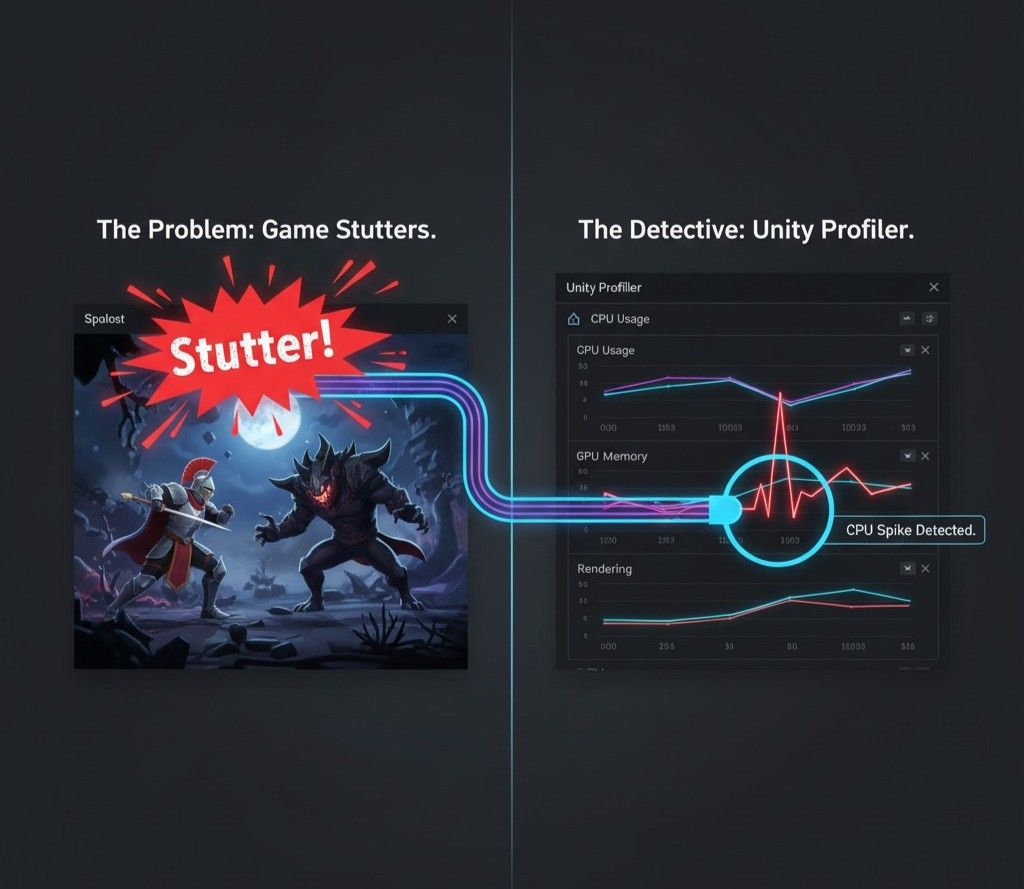
Remember that sinking feeling when you're showing off your game project to friends, and right at the coolest moment, everything starts stuttering? Been there. Actually, I spent my first month at KIXEYE trying to figure out why our mobile strategy game would randomly freeze for half a second. Turns out, I had no idea what was actually happening under the hood of my game.
Here's the thing about game development that no one tells you upfront: building something that works and building something that performs well are completely different challenges. Your game might compile perfectly, look amazing in screenshots, but turn into a slideshow the moment things get interesting. That's where the unity profiler becomes your best friend - think of it as a diagnostic computer that plugs into your game to show you exactly what's eating up your performance.
The Unity Profiler solves the critical problem of identifying why a game might be running slowly, stuttering, or crashing by showing you exactly how your application is using the computer's resources frame by frame. Just like an auto mechanic's diagnostic computer reads data from your car's engine to find problems, the Unity Profiler reads data from your game's CPU, GPU, and memory to help you fix performance issues. By visualizing complex performance data, it transforms the guesswork of optimization into a clear, data-driven process.
Here's What Really Happens When Games Lag
When I first started at CMU, I thought performance was just about "making code faster." Actually, wait - that's like saying cooking is just about "making food hot." The Unity Profiler taught me that game performance is this intricate dance between your CPU, GPU, and memory, and understanding this dance is what separates hobby projects from professional games.
The Unity Memory Profiler acts as your diagnostic tool that shows you exactly how your application uses computer resources frame by frame. This allows you to create smoother, more optimized, and professional-quality games by pinpointing the exact lines of code, assets, or rendering processes causing bottlenecks.
You know what's funny? I used to think optimization meant just "cleaning up my code." But games are different beasts entirely. They're running 60 times per second, updating physics, rendering graphics, playing audio, handling input - all simultaneously. When something goes wrong, you need to know exactly what's taking too long in each frame.
The profiler in Unity becomes essential because it reveals the invisible. Your game might look fine on your development machine but crawl on your friend's laptop. Or worse, it might run perfectly for 10 minutes, then suddenly start hitching because of memory issues you never saw coming.
The Performance Vocabulary That Actually Matters
Before diving into the Profiler window, it's crucial to understand the vocabulary it uses to describe your game's performance. Trust me, I learned these terms the hard way during late-night debugging sessions.
Let me break down what the Unity Performance Profiler is actually measuring:
Profiler Module - This refers to a specific section of the Profiler window dedicated to analyzing one area of your game's performance, such as CPU Usage, GPU Usage, Memory, or Audio.
Frame - In game development, a frame represents a single cycle of the game loop, where all updates and rendering for a single image on screen are performed. The Profiler displays performance data on a per-frame basis.
Sample - A sample is a single measurement of a specific operation's performance captured by the Profiler within a frame, which helps break down exactly what's happening and how long it's taking.
CPU-Bound vs. GPU-Bound - Your application is considered CPU-bound when the Central Processing Unit (CPU) is the bottleneck preventing the frame rate from being higher, whereas it's GPU-bound when the Graphics Processing Unit (GPU) is the component limiting performance.
Garbage Collection (GC) - This is the process of automatically freeing up memory that's no longer in use by your scripts. However, frequent or large garbage collection events can cause noticeable stutters or freezes in your game.
Draw Call - A draw call is a command from the CPU to the GPU to draw an object on the screen. Having an excessive number of these calls in a single frame is a common cause of performance issues.
Batching - This is an optimization technique where Unity groups multiple objects into a single draw call to reduce the communication overhead between the CPU and GPU, thereby improving rendering performance.
Deep Profile - This is a special, resource-intensive mode in the Profiler that instruments every single C# function call, providing highly detailed analysis at the cost of significant performance overhead during profiling.
Your Unity Profiler Toolkit - What Each Module Does
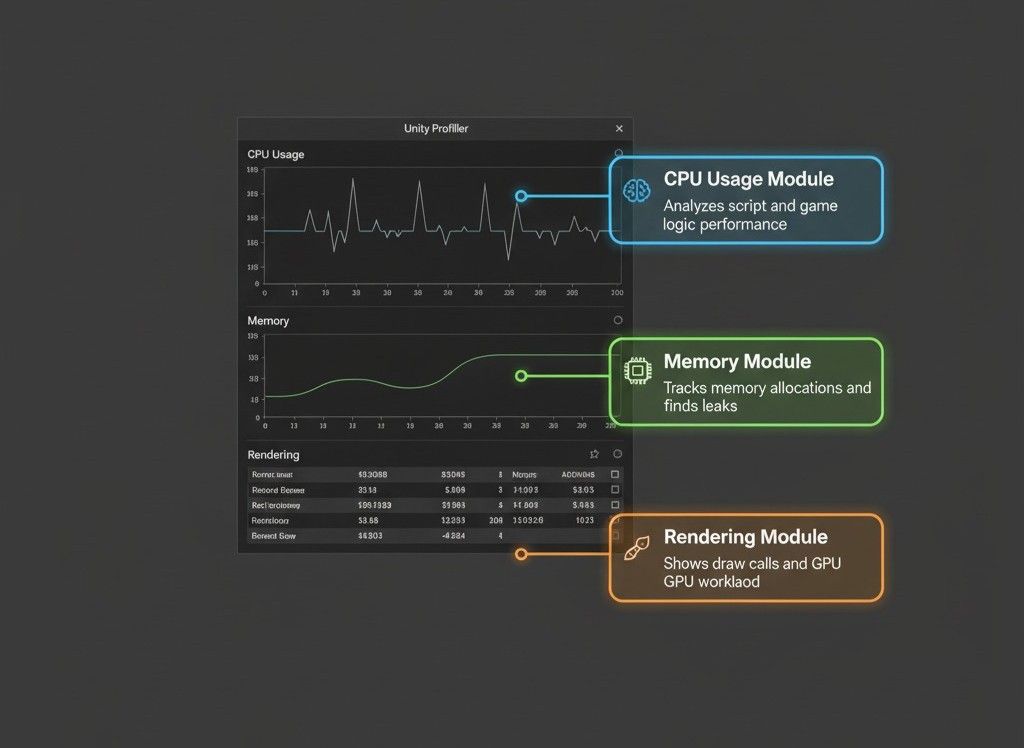
The Profiler is organized into modules, each providing a different lens through which to view your game's performance. Understanding the primary modules is the first step to effective optimization.
The unity cpu profiler - Your Code's Report Card
The CPU Usage Module is often the most critical module, as it shows you how much time is spent executing your game logic, physics, and other scripts. It helps you identify inefficient algorithms or functions that are taking too long to complete each frame.
Verified: Unity Docs - CPU Usage Profiler module introduction
Here's an example of inefficient code that would cause a spike in the CPU Usage graph:
// 3D & 2D Version
// An inefficient loop that could cause a spike in the CPU Usage graph.
void Update()
{
    for (int i = 0; i < 10000; i++)
    {
        // This complex calculation runs every frame, causing high CPU load.
        float result = Mathf.Sqrt(i) * Mathf.Sin(i);
    }
}
I remember debugging something exactly like this at KIXEYE. A junior developer had written what seemed like innocent math calculations, but running them 10,000 times every frame was killing our mobile performance.
Memory Module - The Garbage Detective
The Memory Module tracks all memory allocations your game makes, which is crucial for finding memory leaks or sources of excessive garbage collection. A common issue it reveals is the continuous creation of new objects in an Update loop, which allocates memory every frame.
Verified: Unity Docs - Memory Profiler module introduction
// 3D & 2D Version
// This code generates "garbage" every frame, leading to performance stutters.
void Update()
{
    // Creating a new string each frame allocates memory and triggers Garbage Collection.
    string myString = "Player Health: " + GetHealth();
    Debug.Log(myString);
}

private int GetHealth()
{
    return 100; // Example health value
}
Rendering Module - Your Visual Performance Inspector
The Rendering Module provides a detailed breakdown of everything related to rendering your scene, such as the number of draw calls (SetPass calls) and batches. It's the primary tool for diagnosing if your game is GPU-bound because of overly complex scenes or materials.
Verified: Unity Docs - Profiler modules
// 3D & 2D Version
// This script, when attached to many individual objects, can increase draw calls.
// The Profiler's Rendering module would show a high number of SetPass calls
// if these objects don't share materials and cannot be batched.
void Update()
{
    // Each object with this script and a unique material will likely result in a separate draw call.
    transform.Rotate(0, 5f * Time.deltaTime, 0);
}
Editor vs Build Testing: I Learned This the Hard Way
When profiling, you have two main environments to collect data from: the Unity Editor itself or a standalone Development Build. The choice significantly impacts the accuracy of the data you collect.
| Criteria | Approach A: Profiling in the Editor | Approach B: Profiling a Development Build |
|---|---|---|
| Best For | Quick, iterative checks and debugging during development to catch obvious performance issues early. | Accurate performance analysis, final optimization passes, and testing on the actual target hardware. |
| Performance | The Profiler data includes the overhead of the Unity Editor itself, which can skew results and hide the true performance of your game. | Provides a much more accurate representation of your game's real-world performance without the Editor's overhead. |
| Complexity | Very simple to use; just open the Profiler window (Ctrl+7) and press Play in the Editor. | Requires creating a build with the "Development Build" and "Autoconnect Profiler" checkboxes enabled, then running the build while the Profiler is open in the Editor. |
Took me months to figure out why my game ran fine in the Editor but crawled on actual hardware. The Editor adds so much overhead that your performance data becomes almost meaningless. Always profile on your target device for real optimization work.
Why This Changes Everything for Student Developers
Mastering the Unity Profiler isn't just about fixing problems - it's about unlocking your game's full potential and delivering a better player experience.
Achieve Smoother Gameplay - By identifying and eliminating performance spikes and bottlenecks, you can achieve a stable, high frame rate, which is critical for player enjoyment and immersion.
Enable More Complex Scenes - Understanding where your performance budget is being spent allows you to make informed decisions, enabling you to add more characters, effects, and details without sacrificing performance.
Reduce Crashes and Freezes - The Memory Profiler is invaluable for hunting down memory leaks, which are common causes of application instability and crashes, especially on memory-constrained platforms like mobile devices.
Widen Your Audience - An optimized game can run on a broader range of hardware, from high-end PCs to lower-spec laptops and mobile devices, significantly increasing your potential player base.
Faster, Data-Driven Development - The Profiler replaces guesswork with hard data, allowing you to focus your optimization efforts where they will have the most impact, saving you countless hours of trial-and-error.
When I was building my first real project at CMU, I spent weeks trying to optimize the wrong things. The Profiler would have shown me in minutes what was actually eating my performance budget.
The Pro Tricks I Wish Someone Had Told Me
Using the Profiler effectively involves more than just reading the graphs. These professional tips will help you get the most out of your profiling sessions.
Always Profile on Target Hardware
Performance can vary dramatically between your development machine and the target device (e.g., a mobile phone or console), so you should always run a Development Build on the actual hardware for the most accurate data.
Establish a Performance Baseline
Before you begin optimizing, capture a profile of your game in its current state to establish a baseline, which will allow you to clearly measure the impact of your changes.
Use Profiler Markers for Custom Analysis
To measure the performance of specific code blocks, you can wrap them in custom Profiler Markers, which will then appear as distinct entries in the CPU profiler, allowing you to isolate and analyze their impact with precision.
Verified: Unity Docs - Adding profiling information to your code
// 3D & 2D Version
using UnityEngine;
using Unity.Profiling; // Required for custom markers

public class AiBehavior : MonoBehaviour
{
    // Create a static marker to avoid creating it every frame
    private static readonly ProfilerMarker m_PathfindingMarker = new ProfilerMarker("AI.Pathfinding");
    private static readonly ProfilerMarker m_StateUpdateMarker = new ProfilerMarker("AI.StateUpdate");

    void Update()
    {
        // Begin a sample for the pathfinding section
        m_PathfindingMarker.Begin();
        FindPathToTarget();
        m_PathfindingMarker.End(); // End the sample

        // Begin a sample for the state update section
        m_StateUpdateMarker.Begin();
        UpdateAiState();
        m_StateUpdateMarker.End(); // End the sample
    }

    void FindPathToTarget() { /* ... complex pathfinding logic ... */ }
    void UpdateAiState() { /* ... logic for AI decisions ... */ }
}
Beware of Garbage Collection Spikes
In the Memory module, watch for GC.Alloc samples. These indicate memory allocation. To avoid them in performance-critical code, cache frequently used objects and use object pooling instead of repeatedly instantiating and destroying GameObjects.
// 3D & 2D Version
// BAD: Creates garbage every time the coroutine runs
IEnumerator BadCoroutine()
{
    yield return new WaitForSeconds(1f); // Allocates new memory
}

// GOOD: Caches the WaitForSeconds object to avoid garbage collection
private WaitForSeconds _cachedWait = new WaitForSeconds(1f);
IEnumerator GoodCoroutine()
{
    yield return _cachedWait; // Reuses the existing object, no new memory allocated
}
Games That Nailed Performance (And How They Did It)
Let me share some examples of games I've studied that brilliantly solved performance challenges - these are the implementations I always point my students toward.
Vampire Survivors - The Chaos Optimization
I find this game fascinating from a technical perspective. The mechanic involves spawning hundreds, eventually thousands, of enemies and projectiles on screen simultaneously.
What makes this brilliant is how the developers likely used the Profiler to intensely optimize the CPU usage of each individual enemy's AI and physics calculations. They would have focused on minimizing the cost of each enemy's Update loop and used the Rendering module to ensure that drawing thousands of sprites was done efficiently, likely through techniques like sprite batching.
The direct result is a smooth, fluid experience even amidst absolute on-screen chaos. The high performance allows the core "power fantasy" of the game to shine, as the player is never bogged down by lag or stuttering, no matter how many enemies appear.
Minecraft - The Infinite World Challenge
After analyzing this game's approach, what stands out is how they generate and render a massive, procedurally generated world made of millions of individual blocks.
The Profiler would have been essential for optimizing the chunk loading and rendering systems. Developers would use the CPU Usage module to analyze the performance of the world generation algorithms and the Rendering module to optimize how chunks of blocks are combined into single meshes (a form of batching) to drastically reduce draw calls.
This optimization allows for vast view distances and a seamless exploration experience. Players can look out over huge landscapes without the game grinding to a halt, which is fundamental to the sense of scale and adventure the game provides.
Beat Saber - The VR Performance Standard
Here's why I always recommend studying this game's approach: it's a VR rhythm game that requires extremely low latency and a perfectly stable, high frame rate to ensure player actions sync precisely with the music and visuals.
For a VR title like Beat Saber, maintaining a high and constant frame rate (e.g., 90 or 120 FPS) is non-negotiable to prevent motion sickness. The developers would have used the Profiler to scrutinize every single millisecond of the frame time. They would analyze CPU usage to ensure game logic is minimal and GPU usage to optimize the neon-drenched visuals, shaders, and particle effects to guarantee they never cause a single dropped frame.
The result of this rigorous optimization is a comfortable and highly responsive VR experience. The player feels a perfect connection between their physical movements and the in-game actions, which is the core of what makes the game so satisfying and immersive.
Let Me Walk You Through Three Real Fixes
Let me show you how I approach actual performance problems using the Profiler. These are the exact methods I use when debugging my own projects.
Fix #1: Diagnosing Frame Rate Spikes from Object Spawning
Scenario Goal: Identify and fix a noticeable stutter that occurs whenever the player fires a weapon that instantiates a new projectile.
Unity Editor Setup:
- Create a "Player" GameObject (a simple Cube is fine)
- Create a "Projectile" Prefab (a simple Sphere is fine)
- Attach the following
PlayerControllerscript to the "Player" GameObject
My Step-by-Step Approach:
First, I write the problematic code. This script instantiates a new projectile prefab every time the Fire1 button (left-click) is pressed. This is a very common way to implement shooting but can be inefficient if done frequently.
// 3D Version
using UnityEngine;

public class PlayerController : MonoBehaviour
{
    public GameObject projectilePrefab;
    public float projectileSpeed = 20f;

    void Update()
    {
        // Fire a projectile on left-click
        if (Input.GetButtonDown("Fire1"))
        {
            // This Instantiate call can be expensive if called rapidly
            GameObject projectile = Instantiate(projectilePrefab, transform.position + transform.forward, transform.rotation);
            Rigidbody rb = projectile.GetComponent();
            if (rb != null)
            {
                rb.velocity = transform.forward * projectileSpeed;
            }
            Destroy(projectile, 5f); // Clean up the projectile after 5 seconds
        }
    }
} // 2D Version
using UnityEngine;
public class PlayerController2D : MonoBehaviour
{
public GameObject projectilePrefab;
public float projectileSpeed = 20f;
void Update()
{
if (Input.GetButtonDown("Fire1"))
{
GameObject projectile = Instantiate(projectilePrefab, transform.position, transform.rotation);
Rigidbody2D rb = projectile.GetComponent();
if (rb != null)
{
rb.velocity = transform.up * projectileSpeed;
}
Destroy(projectile, 5f);
}
}
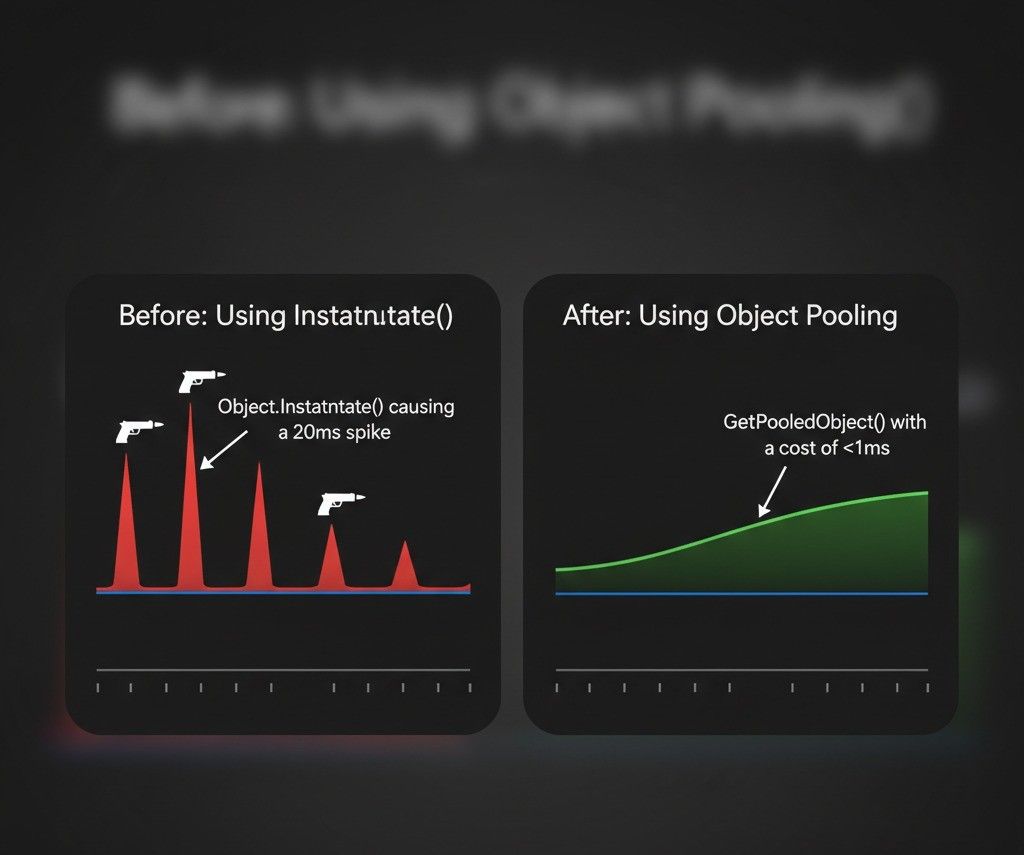
} Next, I use the Profiler to diagnose the issue. Open the Profiler (Window > Analysis > Profiler), press Play, and click rapidly in the Game view. You'll see a sharp spike in the CPU Usage graph each time you click. Pause the Editor and click on one of these spikes. In the Hierarchy view below, you'll see that PlayerController.Update() and, more specifically, Object.Instantiate() are taking up a significant amount of time. This confirms that instantiation is our bottleneck.
To fix this, I implement a simple object pool. This pattern involves pre-instantiating a collection of objects at the start and then simply activating and deactivating them as needed, which avoids the expensive Instantiate and Destroy calls during gameplay.
Verified: Unity Docs - Object Pooling
// 3D Version - Optimized with Object Pooling
using System.Collections.Generic;
using UnityEngine;

public class PlayerControllerOptimized : MonoBehaviour
{
    public GameObject projectilePrefab;
    public int poolSize = 20;
    public float projectileSpeed = 20f;

    private List projectilePool;
    private int currentPoolIndex = 0;

    void Start()
    {
        // Pre-instantiate all the projectiles at the start
        projectilePool = new List();
        for (int i = 0; i < poolSize; i++)
        {
            GameObject proj = Instantiate(projectilePrefab);
            proj.SetActive(false); // Start with them disabled
            projectilePool.Add(proj);
        }
    }

    void Update()
    {
        if (Input.GetButtonDown("Fire1"))
        {
            // Get the next projectile from the pool instead of instantiating
            GameObject projectile = GetPooledProjectile();
            if (projectile != null)
            {
                projectile.transform.position = transform.position + transform.forward;
                projectile.transform.rotation = transform.rotation;
                projectile.SetActive(true); // Activate it

                Rigidbody rb = projectile.GetComponent();
                if (rb != null)
                {
                    rb.velocity = transform.forward * projectileSpeed;
                }
            }
        }
    }

    private GameObject GetPooledProjectile()
    {
        // Cycle through the pool
        GameObject projectile = projectilePool[currentPoolIndex];
        currentPoolIndex = (currentPoolIndex + 1) % poolSize;
        return projectile;
    }
}
Now, when I run the Profiler again with the optimized script, the large spikes on Fire1 are gone, replaced by a much smaller and more consistent CPU cost. This demonstrates how the Profiler helps you identify and validate performance optimizations.
Fix #2: Tracking Down a Memory Leak from Event Subscriptions
Scenario Goal: Discover why the memory usage of our game keeps increasing over time, eventually leading to a crash, by identifying an object that's not being properly destroyed.
Unity Editor Setup:
- Create an empty GameObject named "GameManager"
- Attach the
GameManagerscript to it - Create a simple Cube GameObject and attach the
DestructibleCubescript to it. Make this Cube a Prefab - Create another script,
CubeSpawner, and attach it to the "GameManager" GameObject
My Step-by-Step Investigation:
First, I set up the GameManager with a public event. This is a common pattern for decoupled communication between systems.
// 3D & 2D Version
using System;
using UnityEngine;
public class GameManager : MonoBehaviour
{
public static event Action OnGameOver;
public void TriggerGameOver()
{
Debug.Log("Game Over!");
OnGameOver?.Invoke();
}
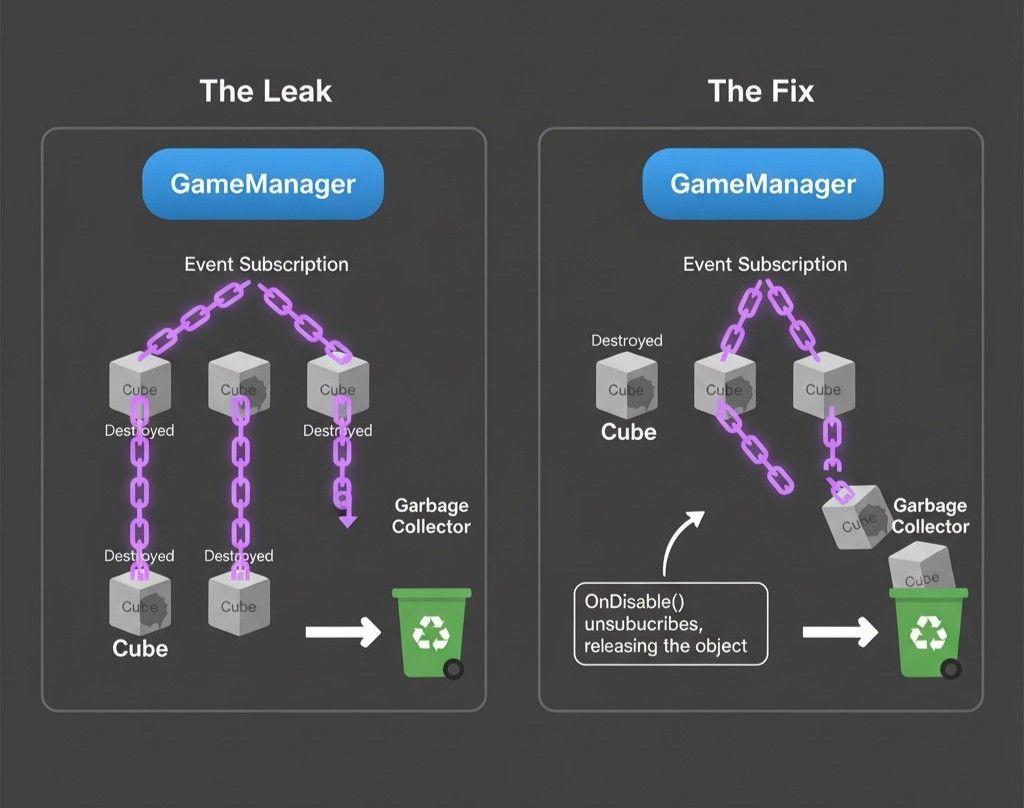
}Now, I create the DestructibleCube script. This script subscribes to the OnGameOver event. The critical mistake here is that it never unsubscribes from the event. This means the GameManager will hold a reference to every cube, preventing the Garbage Collector from cleaning them up even after they are destroyed.
// 3D & 2D Version
using UnityEngine;

public class DestructibleCube : MonoBehaviour
{
    void OnEnable()
    {
        // Subscribe to the event
        GameManager.OnGameOver += OnGameOverResponse;
    }

    // MISTAKE: We are missing the OnDisable or OnDestroy method to unsubscribe!
    /*
    void OnDisable()
    {
        // This is the FIX that we will add later
        GameManager.OnGameOver -= OnGameOverResponse;
    }
    */

    void OnGameOverResponse()
    {
        // Do something when the game is over
    }
}
Finally, a spawner script to create and destroy these cubes continuously, simulating a memory leak over time.
// 3D & 2D Version
using UnityEngine;

public class CubeSpawner : MonoBehaviour
{
    public GameObject cubePrefab;

    void Start()
    {
        // Continuously spawn and destroy cubes to demonstrate the leak
        InvokeRepeating(nameof(SpawnAndDestroyCube), 1f, 0.1f);
    }

    void SpawnAndDestroyCube()
    {
        GameObject cube = Instantiate(cubePrefab, Vector3.zero, Quaternion.identity);
        Destroy(cube, 0.05f); // Destroy it almost immediately
    }
}
When I run the game and open the Profiler, selecting the Memory module, I see the "Total Reserved Memory" steadily climbing. I take a "Snapshot" of the memory usage using the Memory Profiler package (Window > Analysis > Memory Profiler). Wait a minute, then take another snapshot. When I compare the two snapshots, there's a huge increase in the number of DestructibleCube objects still in memory, even though they should have been destroyed. This confirms a memory leak.
Verified: Unity Docs - Memory Profiler package
To fix the leak, I simply need to unsubscribe from the event when the object is disabled or destroyed. Uncomment the OnDisable method in the DestructibleCube script.
// 3D & 2D Version - The FIX
void OnDisable()
{
    // Unsubscribe from the event to release the reference
    GameManager.OnGameOver -= OnGameOverResponse;
}
Running the Profiler again shows that memory usage stays stable and doesn't continuously increase, because the cubes are now being properly garbage collected.
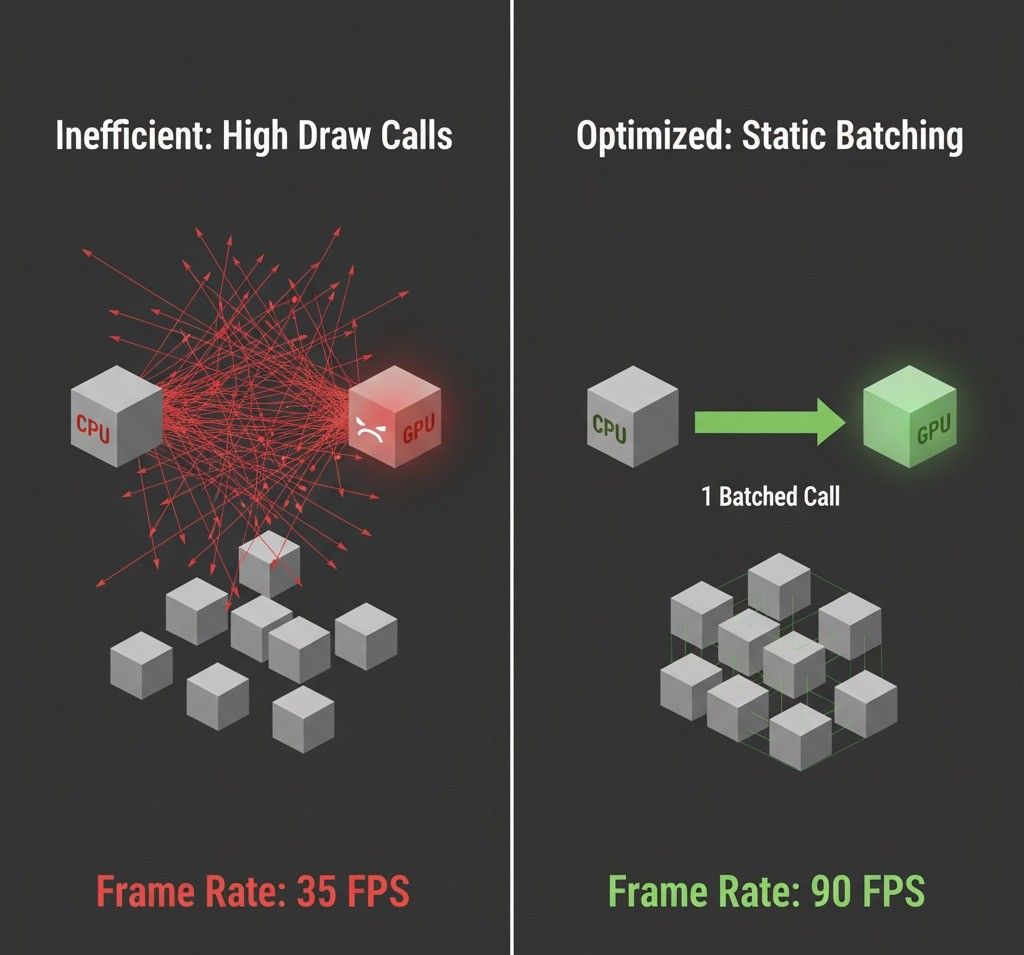
Fix #3: Optimizing Rendering by Analyzing Draw Calls
Scenario Goal: Improve the frame rate in a scene with many objects by identifying high draw call counts and using static batching to reduce them.
Unity Editor Setup:
- Create a new scene
- Create a new Material (e.g., "RedMaterial")
- Create a Cube GameObject, assign the "RedMaterial" to it
- Duplicate this Cube hundreds of times and place them around the scene
- Ensure your camera can see a large number of them at once
My Optimization Process:
There's no initial code for this blueprint; the setup is done entirely in the editor. The goal is to observe the performance impact of many individual objects.
When I open the Profiler (Window > Analysis > Profiler) and select the Rendering module, then press Play, I look at the "SetPass calls" (another name for draw calls) and "Batches" statistics. I see a very high number of SetPass calls, likely one for each visible cube, and a low number of batches. This indicates that the CPU is spending a lot of time telling the GPU to draw each individual cube.
Now, I use static batching to fix this. I select all of the cube GameObjects in the Hierarchy. In the Inspector window, in the top-right corner, I check the "Static" checkbox. A dropdown appears; I ensure "Batching Static" is checked.
When I press Play again and observe the Profiler, there's a dramatic drop in the "SetPass calls" and a significant increase in the "Batches" count. Unity is now combining the geometry of all the static cubes into large meshes and drawing them in a few large batches, which is much more efficient. The frame rate, visible in the CPU Usage module, should be noticeably higher. This process demonstrates how the Profiler can be used to verify the effectiveness of rendering optimizations.
Verified: Unity Docs - Draw call batching
What You'll Gain from Mastering This
Here's what changes when you really understand performance profiling: you stop guessing and start knowing. Instead of randomly tweaking settings hoping something works, you make surgical improvements based on real data.
You'll achieve smoother gameplay by eliminating those annoying hitches that break player immersion. Your games will feel more professional because consistent performance is one of the biggest differences between student projects and commercial releases.
You'll be able to create more ambitious projects. When you understand your performance budget, you can push boundaries intelligently. Want more enemies on screen? More particle effects? Complex AI? The Profiler shows you exactly what you can afford.
Most importantly, you'll develop confidence as a developer. There's something powerful about being able to diagnose and fix performance issues systematically instead of just hoping they go away.
Your Next Steps as a Developer
Start simple. Open the Profiler on your current project and just watch the CPU Usage module while you play. You don't need to fix anything yet - just get familiar with seeing your game's performance in real-time.
Try the custom Profiler Markers I showed you. Pick one function in your code that you're curious about and wrap it in markers. See how much time it actually takes.
Most importantly, always profile on your target device before you ship. The difference between Editor performance and real-world performance will surprise you.
Wrapping Up
The unity profiler transforms game optimization from guesswork into a systematic, data-driven process. It's like having X-ray vision for your game's performance - suddenly, all those mysterious stutters and slowdowns become clearly visible problems with specific solutions.
Whether you're building your first indie game or working on a complex multiplayer project, understanding performance is what separates hobby projects from professional-quality games. The Profiler gives you the tools to deliver the smooth, responsive experience your players deserve.
Remember: optimization isn't about perfection, it's about making informed decisions with real data. Start profiling your projects today, and you'll never go back to guessing about performance again.
Key Takeaways
- The Unity Profiler acts as a diagnostic tool that shows exactly how your game uses CPU, GPU, and memory resources frame by frame
- Always profile on target hardware rather than in the Editor for accurate performance data - Editor overhead can completely skew your results
- Use custom Profiler Markers to measure specific code sections and identify exactly which functions are causing performance bottlenecks
- Memory leaks often come from event subscriptions that aren't properly unsubscribed - watch for continuously increasing memory usage in the Memory module
- Object pooling eliminates expensive Instantiate/Destroy calls by reusing pre-created objects instead of creating new ones each frame
- Static batching dramatically reduces draw calls by combining multiple objects with the same material into single rendering operations
- Establish performance baselines before optimizing so you can measure the actual impact of your changes with concrete data
- The three main modules (CPU Usage, Memory, Rendering) each reveal different aspects of performance - CPU shows script efficiency, Memory tracks allocations and leaks, Rendering shows GPU bottlenecks
Common Questions
The Unity Profiler is a diagnostic tool that shows you exactly how your game uses computer resources like CPU, GPU, and memory. You need it because it transforms performance optimization from guesswork into data-driven decisions, helping you identify the specific causes of lag, stuttering, or crashes in your game.
Open the Profiler by going to Window > Analysis > Profiler or using the keyboard shortcut Ctrl+7. The Profiler window will show various modules like CPU Usage, Memory, and Rendering that each analyze different aspects of your game's performance.
Profile in the Editor for quick iterative debugging during development, but always use Development Builds for accurate optimization work. The Editor adds significant overhead that can hide your game's true performance, so build testing gives you realistic data that matches what players will experience.
CPU-bound means your Central Processing Unit is the bottleneck limiting your frame rate, usually caused by inefficient scripts or too many calculations per frame. GPU-bound means your Graphics Processing Unit is limiting performance, typically from complex shaders, too many draw calls, or high-resolution textures.
The Unity Editor has significant overhead that masks performance issues, plus your development machine likely has more powerful hardware than your target devices. Always test on actual target hardware with Development Builds to see realistic performance.
Avoid creating new objects in frequently called functions like Update(). Instead, cache objects like WaitForSeconds, use object pooling for frequently spawned items, and minimize string concatenation. The Memory Profiler will show you exactly where garbage allocation is happening.
Draw calls are commands from the CPU telling the GPU to render an object. Each call has overhead, so having thousands of individual draw calls per frame can bottleneck your CPU. Use techniques like static batching to combine multiple objects into fewer draw calls.
Import Unity.Profiling, create static ProfilerMarker objects, then wrap your code with marker.Begin() and marker.End(). This makes your custom code sections appear as named entries in the CPU Profiler, letting you measure their exact performance impact.
A frame represents one complete cycle of your game loop (typically 1/60th of a second at 60 FPS). A sample is a measurement of a specific operation within that frame, like how long a particular function took to execute.
Always establish a performance baseline before making changes by recording your current frame times and memory usage. After optimization, compare the new Profiler data to your baseline to see concrete improvements in frame rate, reduced memory allocation, or fewer draw calls.